
An Investor Guide to the new ISSB disclosures
Big news came in on June 26th with the International Sustainability Standards Board (ISSB) releasing their climate disclosure standards here. In July, the ISSB also announced they are taking over the Task Force on Climate-related Financial Disclosures (TCFD) reporting. So that means no more TCFD, just ISSB climate disclosures, with many national accounting bodies taking on ISSB in 2024. So what is needed?
In terms of the type of disclosures needed for ISSB alignment, there are four sections ‘Governance’, ’Strategy’, ‘Risk Management’, ‘Metrics and Targets’. You can get a detailed overview on each section here on our website.
Many investors have calculated their Scope 3 financed emissions footprint but under ISSB, the new disclosures specifically require investors to declare climate risks in particular: “The amount and percentage of assets vulnerable to transition risks – i.e. risks arising from transition to a lower-carbon economy”. This is where you need to run multiple climate scenarios through your portfolio to understand and disclose that climate risk.
I want to give you a guide to answer those ISSB questions using the ASX300 portfolio as an example.
How to quantify climate transition risk?
You may have already quantified your financed emissions footprint (if not reach out). Estimating footprints are important first steps, but they tell you nothing about whether an asset or portfolio is a risk to the carbon transition.
Carbon transition risk really comes down to understanding how dependent an asset is on producing carbon emissions per unit of economic value.
Steel companies or airlines, for example, must produce lots of carbon emissions in producing and selling their products - they have no way around it, at least today. On the other hand, timber companies or trains are more carbon efficient resulting in lower carbon transition risk.
But aside from qualitative hand-waving arguments, how do we quantitatively assess carbon transition risk? Within a sector, what makes one company less risky than others? That is where combining climate with finance is important.
Consider two companies making widgets that both emit 1million tonnes each year. One company is 100 times the size of the other, meaning it has 1/100 of the carbon efficiency as the other company. Calculating the carbon efficiency (using Enterprise Value or Revenue) is a common way to compare carbon efficiencies of companies. I’ve plotted the carbon efficiency of revenue for the ASX300 in Australia using our latest 2023 footprint predictions at Emmi and broken it down per sector.
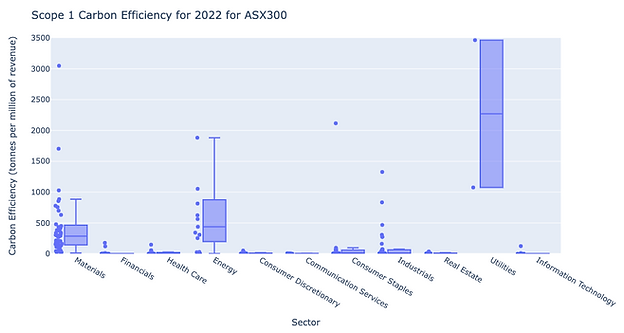


The range of carbon efficiency dramatically varies from near 0 for Scope 1 for financial companies to more than 10,000 for Scope 3 energy companies. Where is the cutoff for carbon risk amongst this huge range of carbon efficiencies? And how do you adjust company valuations due to emerging carbon prices?
That is where integrating climate scenario analysis is important. It can guide us on how global emissions can change, how carbon might be priced and ultimately what the financial implications will be for each company, asset and portfolio.
So in order to disclose the amount and percentage of assets vulnerable to climate transition risks under ISSB you need four things:
- Footprint: Financed emissions footprint for each asset in your portfolio - including Scope 1 and 2 at least (see my earlier post on how to do this)
- Scenarios: Choose 2-3 scenarios covering low carbon world (Net-Zero or below 2°C) and Hot-house world (3-4°C) - see below
- Value-at-Risk: Translate footprints for an asset into financial terms like Potential Carbon Losses or Value at Risk (VaR) for any given climate scenario (see my earlier post on how this is done)
- Portfolio: Aggregate those potential carbon losses across your portfolio to report on the risk
What climate scenarios to choose?
Climate scenarios have been developed using a variety of global climate models that quantifies alternative storylines about how the world might develop over the coming century. Each scenario is developed with different assumptions for population, economic growth, technology advancements, energy demand/supply, land-use changes and greenhouse gas emissions.
Some of the most prominent scenarios are the Intergovernmental Panel on Climate Change Shared Socio-economic Pathways (IPCC-SSPs), the Network for Greening the Financial System (NGFS), and the Principles for Responsible Investment Inevitable Policy Response (PRI-IPR).
There are many scenarios to choose from and the ISSB is yet to prescribe scenarios, however as a minimum, a low carbon ‘Net-Zero’ scenario and a ‘Hot-House’ scenario is needed to give the adequate spread of climate risk.
What does carbon look like in future?
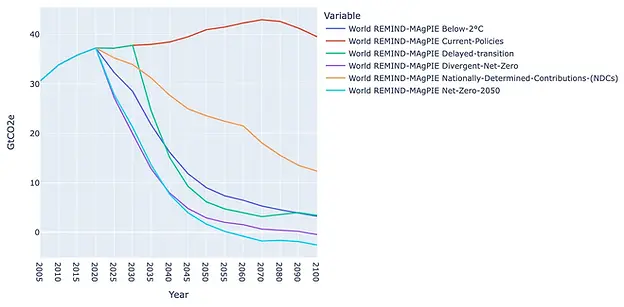
To give you a perspective of the different future carbon budgets under NGFS, I’ve plotted the global industrial carbon budget in billions of tonnes below for all scenarios. The ‘Current Policies’ scenario is characterised as a ‘Hot-house’ scenario with carbon increasing until 2080 with 3°C warming (red-line). Meanwhile the ‘Net-Zero’ and ‘Below 2°C’ scenarios follow a steep decarbonisation by 2050 that limit warming to 1.5-2°C (light and dark blue lines).
How do your assets get impacted under each scenario?
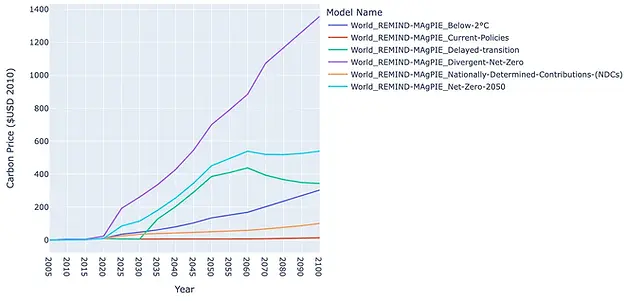
Each climate scenario has a future carbon price projected which depends on a range of factors. By 2030, those prices range from $10 to $180 per tonne depending on the scenario. Under NGFS Net-Zero scenarios carbon prices reach $400-500 tonne by 2050 (see below).
So how does that future carbon price impact an asset? It entirely depends on whether an asset is emitting under their carbon budget allowance for a given scenario. The amount of carbon a company is emitting versus their carbon budget allowance is known as the ‘carbon gap’ or carbon over-spend. The carbon gap is where potential carbon costs/liabilities are expected under that scenario.
The key takeaway:
If a company doesn’t need to reduce emissions, then there is no flow-on carbon liability or financial risk from carbon prices.
One of the biggest challenges in performing climate scenario analysis is translating climate scenarios into financial impacts attributed within each sector. Airlines for example are under the ‘Transportation’ sector within the NGFS scenarios which have a very different carbon budget trajectory than other sectors like ‘Services’.
So in order to understand the financial impact of each scenario for a given portfolio, sector carbon budgets are required for each that can be mapped specifically down to the company level. At Emmi we have mapped all 46,000 publicly listed companies into aligned sectors, allowing company level carbon budget allowances for any climate scenario.
So lets take a look at the largest 300 companies in Australia (ASX300) as an example.

How much does the ASX300 need to decarbonise?
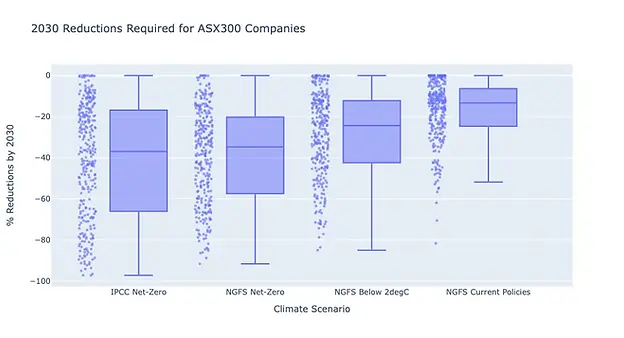
The first thing to quantify for each portfolio holding are their decarbonisation reduction targets (or carbon budget allowances) under various climate scenarios. Although the reductions needed vastly change depending on the carbon efficiency of a particular company, the spread of the reductions required by 2030 are shown below.
Some companies don’t have reduction requirements so don’t have any risk, but the majority of companies are within the -20 to -65% by 2030 range to be aligned with either the Net-Zero or NGFS 2°C scenarios. And then their are other companies needing greater than 50% reduction by 2030 to be aligned with a low-carbon scenario. Interestingly, most companies will even need to decarbonise between 10 and 25% by 2030 in order to be aligned with the ‘Current Policies’ scenario.
How do decarbonisation needs change for each sector and scenario?
I’ve charted these for each sector on ASX300 below across IPCC and NGFS scenarios. For the Utilities and Energy sectors, deep decarbonisation is required for all scenarios, while for other sectors, the spread is quite broad.
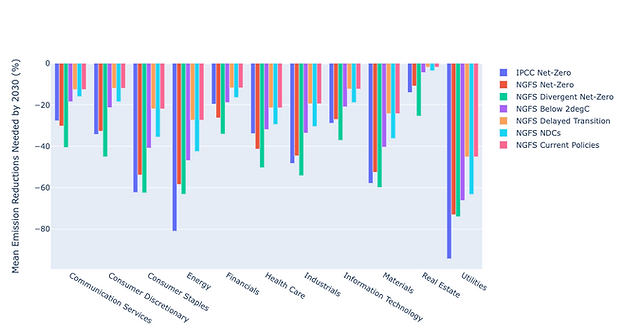
You can see for the Financials and Healthcare sectors, the NGFS scenarios have the most decarbonisation requirements in comparison to the IPCC. That is because some of the carbon allowances in carbon efficient sectors like Financials and Healthcare are shifted to the hard to abate sectors (like transport and energy) under the NGFS. There’s lots to digest in this chart, but it gives a good perspective of the decarbonisation requirements for sectors under various climate scenarios.
What’s the amount and percentage vulnerable to transition risk?
If carbon were priced today, how much of your capital could be at risk now, and how will this change over time as carbon becomes costlier under different scenarios? That is what ISSB is looking for. Typically the metric used to quantify transition risk is called ‘Value at Risk (VaR)’. We refer to a similar metric at Emmi called ‘Potential Capital Loss (PCL)’ and is a measure of how much enterprise value is eroded over time from carbon costs (see how we do this here).
For the ASX300 companies, the amount and percentage of assets vulnerable to the transition differ significantly between each scenario, as shown below.
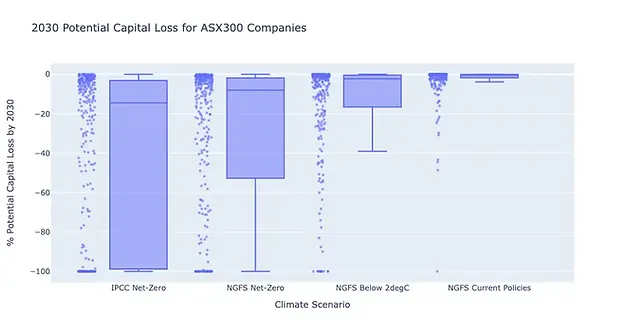
Under the Net-Zero scenarios at least 30% of the ASX300 companies value is at risk amounting to an average company liability of $1.7billion per year by 2030. For the 2°C scenario, the potential capital loss drops by more than half to 14% and $700million average company liability. Meanwhile for the Current Policies scenario, the amount and percentage vulnerable to the transition drops to just 3% and potential carbon liability of $129 million on average.
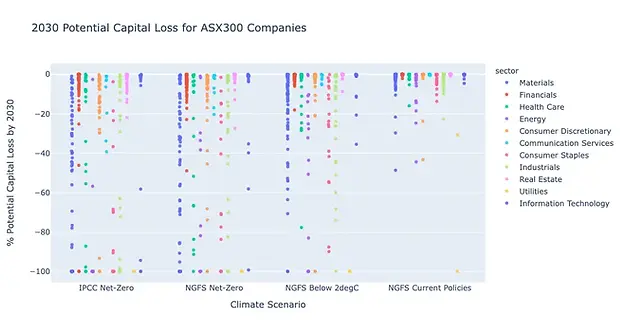
As you would expect, there is a large tail in the breakdown of the sectors most financially vulnerable to the climate transition. Those highest risk companies are found in the Utilities, Energy, Materials and Industrials sectors, with some even vulnerable under the Current Policies climate scenario.
Climate Scenario Analysis for your Portfolio?
In order to inform ISSB reporting, quantifying how various climate scenarios will impact your investments is becoming mandated by 2024 in most jurisdictions. The ASX300 example above was a brief run through of how our climate risk engine at Emmi provides all the science-backed analytics and insights needed for your ISSB reporting. Reach out if you want to find out more on how we can help for your portfolio.