
Hello everyone,
The politics of COP26 in Glasgow is over and the financial world continues to accelerate towards net-zero. Investors are looking to better identify, quantify and solve for the carbon transition risk in their portfolios. So what are the best carbon metrics to do that?
Timely and accurate carbon emissions data for companies is the first obvious step. But as I have written previously, carbon foot-printing alone is virtually useless to assess the carbon risk of a portfolio.
To be efficient and compete in a carbon constrained world it’s not about smaller carbon footprints, it’s about optimising for the value you create per unit of carbon. So beyond just carbon foot-printing, what metrics are used to understand carbon risk for companies and portfolios?
In this week’s newsletter, I explore the evolution of carbon metrics and the pros and cons of using some like WACI (Weighted Average Carbon Intensity) via a case study of FedEx.
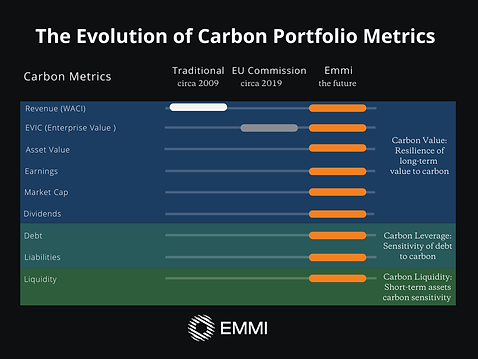
The evolution of carbon financial metrics
‘Carbon Intensity’ was the first carbon financial metric used, introduced back in 1997 by Professor J. Timmons Roberts in a paper that explored national carbon economic productivity. Defined as “the carbon dioxide countries emitted per unit of their gross domestic product”, it introduced the concept of benchmarking carbon emissions relative to economic output.
Over time, carbon intensity became a good metric for many countries, since it allowed easy comparisons between countries while it could help inform national policies that were aligned with their economy. Some countries still prefer using carbon intensity to set targets. In Dec 2020 for example, China announced a target of reducing carbon intensity by more than 60% by 2030.
But using carbon intensity presents some problems. Firstly, national carbon intensity declines naturally via technological advancements, industrial efficiency and GDP growth. Ever since industrialisation, every dollar in GDP has become more carbon efficient, every year - without doing anything - even in China.
China recorded a 81% decline in national carbon intensity since the late 1970s (see below). Yet during that same period, China increased its absolute carbon emissions by nearly seven-fold, reaching 10.7 billion tonnes in 2020. Carbon intensity hides what is happening with total carbon emissions which is why most political leaders tend to set absolute emission targets (eg 50% by 2030 etc).

Despite the drawbacks The ability to benchmark carbon emissions on a financial indicator was the first step towards a useful metric in finance - since companies could be easily compared with each other.
Carbon metrics for Investors: from WACI to Emmi
Over the years, carbon intensity has been applied to financial markets as the leading metric to assess the carbon exposure for a company or portfolio. Instead of benchmarking GDP, carbon intensity in finance is the measure of carbon emissions relative to the economic output of the companies in a fund or portfolio. Typically, revenue has been the financial metric used to benchmark carbon intensity of emissions for companies, expressed in tons CO2e / $M revenue.
1) The Weighted Average Carbon Intensity (WACI)
For investors, the Weighted Average Carbon Intensity (WACI) has become a key metric that uses the carbon intensity by revenue for companies. WACI measures a portfolio’s exposure to carbon-intensive companies by revenue, expressed in tons CO2e / $M revenue. Emissions are allocated based on portfolio weights (the current value of the investment relative to the current portfolio value). WACI has been endorsed by the Task Force on Climate-related Financial Disclosures (TCFD).
2) Enterprise Value with Cash (EVIC)
There are big problems in using WACI alone to assess carbon financial risk (see below), and some progress has been made. In 2019 the European Commission made a significant shift away from WACI. Under the EU Benchmark Regulation, they instead mandated the use of Enterprise Value Including Cash (EVIC) to calculate carbon intensity for companies and portfolios. Enterprise Value is the total value of a company when you take all stock shares, debts, and cash reserves into account.
3) Emmi combines WACI, EVIC and 10 other carbon financial metrics
Instead of using one carbon financial metric however, at Emmi we consider WACI, EVIC + 10 other financial metrics. Why does our algorithm do that? Because it gives a more complete and robust perspective on carbon risk. From debt, liquidity, dividends, cash and company value - it allows us to give a comprehensive assessment of the carbon efficiency of a business or portfolio.
The limitations of using single carbon metrics
Imagine if investors only used one decision point as their source of intelligence when making buy/sell-side decisions? For example a company might have great revenue or a high enterprise value but has uncontrollable costs, debt issues, a short term liquidity crunch. One metric alone would miss all these pieces of the carbon valuation puzzle, potentially leading to the erroneous decisions being made on incomplete information.
For example, although WACI is being used by many to assess carbon risk, it has some major problems. The most obvious is that revenue is not an all-inclusive gauge of the financial health of a company.
For carbon risk evaluation, just using revenue and WACI will also lead to significant pieces of the carbon exposure puzzle being missed. In a carbon-constrained world, revenue is only one of many financial fundamentals that will be impacted as carbon is restricted and eventually priced in the market.
Focusing solely on revenue presents major problems for investors to understand the real risks and therefore the opportunities. WACI for revenue misses all the other financial fundamentals from valuation and assets to debt and liquidity. Looking beyond a single metric of value creation we can give greater certainty of how a company might perform in a future constrained world.
FedEx: How WACI alone can hide carbon risk
Federal Express is a US multi-national in transportation and e-commerce, with huge revenues of $183b. In 2020, combining their reported scope 1 & 2 carbon emissions with Scope 3 estimates from our models, FedEx’s total carbon footprint is about 43million tonnes.
If using only carbon intensity of revenue for FedEx, they seem to be highly carbon efficient in comparison to other big businesses. In fact, we find that they get a perfect score on the revenue metric of 100/100, implying great carbon efficiency and a very low risk exposure to the climate transition. The problem is that although FedEx’s huge revenue reduces its revenue exposure to carbon - its operating margins are tight and debt relative to those margins is high. So, when accounting for these broader financial metrics, FedEx carbon transition risk exposure increases substantially.
Instead of looking at just one metric like WACI (revenue), Emmi covers 11 other core financial metrics. The results for FedEx are less optimistic in terms of their overall carbon risk - with an Emmi Score of 42/100 – suggesting greater risk and incompatibility with a carbon constrained world. Very different from the perfect score as judged by just revenue (WACI).
FedEx Case Study: Emmi Carbon Risk Analysis

Using the Emmi platform, we can investigate the carbon exposure relating to each financial metric, from Book Value, Dividends, P/E to Interest and Cash. For FedEx - you can see that the revenue scores are 100/100, while for most other metrics the scores are low (between 0-50).
Digging deeper we can see that there may be challenges ahead for this organisation in preserving their value, servicing their assets, and supporting their debt and dividends when carbon is constrained. These areas drag down the overall Emmi Score - meaning those areas of the business have significantly more carbon risk exposure than just focusing on revenue/sales.
To understand who will survive and thrive in a carbon constrained world we have to look at all pieces of the puzzle; if we focus on only one or two data points we risk missing half of the story.
Stay safe and well,
Ben