
Market Snapshot
Latest S&P500 analysis reveals Scope 1&2 emissions return to 2021 levels, with utilities and energy sectors driving reductions. Top 10 emitters represent 50.6% of emissions yet only 2.8% of market cap.
Our latest Market Snapshot examines emissions trends across the S&P500, revealing key insights into sector performance and climate risk exposure. The analysis highlights significant emissions reductions in utilities and energy sectors, while tracking market responses to recent political developments.
Key Findings:
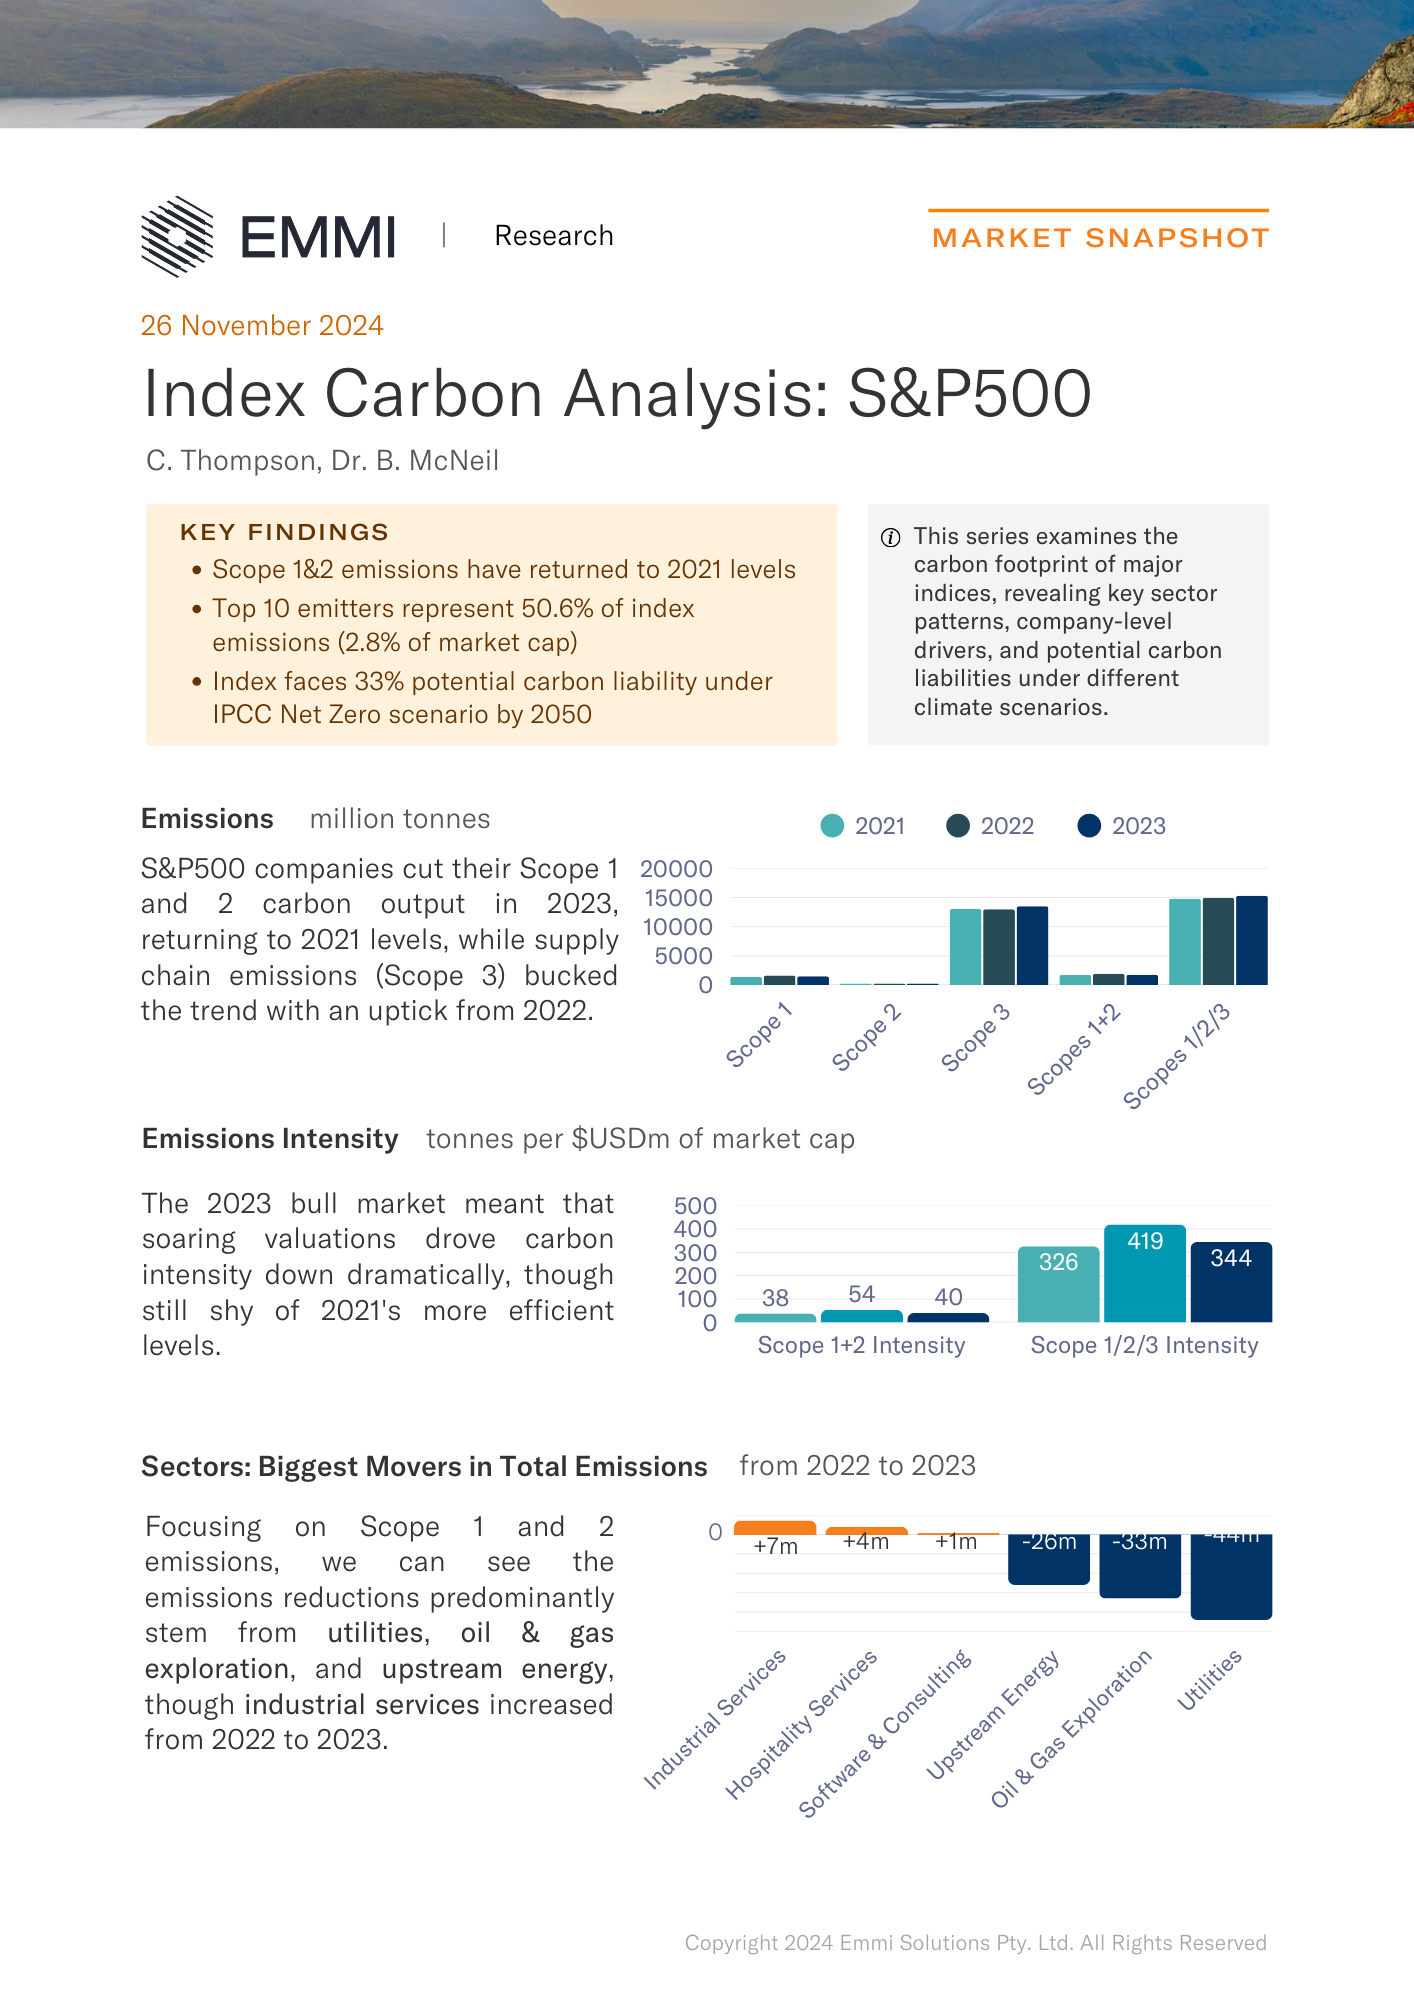
- Scope 1&2 emissions have returned to 2021 levels
- Top 10 emitters represent 50.6% of index emissions (2.8% of market cap)
- Index faces 33% potential carbon liability under IPCC Net Zero scenario by 2050
The research reveals utilities (-44m), oil & gas exploration (-33m), and upstream energy (-26m) drove the largest emissions reductions, though industrial services showed an increase (+7m). Meanwhile, our post-election analysis indicates divergent sector responses, with high-emitting sectors generally outperforming despite market uncertainties.
This analysis forms part of our regular series examining carbon footprints across major indices, providing investors with actionable insights into sector patterns and transition risks. If you'd like to subscribe to receive future Market Snapshots direct to your inbox, you can at the bottom of this page.
Download the full analysis
Stay in the know. Subscribe to updates
Find out about our latest developments, and get our research reports first.