
Globally, there are ~50,000 publicly listed companies. The vast majority (>85%) don’t report carbon emissions. Even when companies do disclose emissions, they 12-18 months old. Timely and deep coverage of emissions for companies does not exist.
At Emmi, we have built award winning machine-learning prediction models that estimate carbon emissions (Scope 1, 2 &3) for virtually any company in the world for the latest calendar year - and at scale. Our models fill the large carbon gap needed to understand portfolio footprints, financed emissions and carbon liabilities and actions for financial institutions and investors.
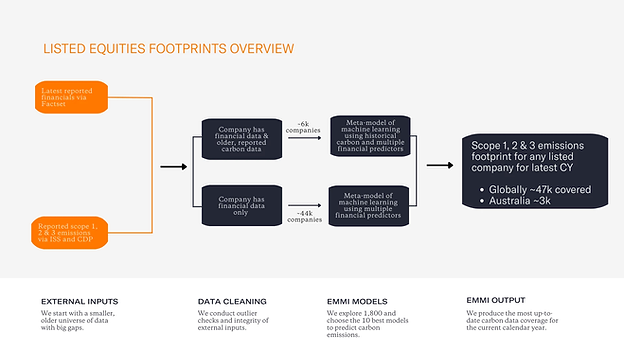
How do we predict carbon for any company?
Estimating company emissions requires certain financial and business information inputs in order to utilise our models. The more input data that can be used translates to higher accuracy and data quality scores under PCAF. For listed companies, the only input required from a customer is an ISIN (International Securities Identification Number). We then extract the financial and business data from Factset, our financial data partner.
How is the Emmi Machine Learning model trained
Emmi Machine Learning Methods
Machine learning is a catch-phrase for mathematical algorithms that ‘learn’ by classifying patterns in data for a given set of inputs and predictor variables. This algorithmic approach has the potential to find and extract the most predictive information from a given data-set. Overall machine learning has the potential to improve the quality of estimates with broader coverage.
In partnership with the University of Otago, our data science team at Emmi have developed novel new machine learning methods to estimate corporate carbon emissions. More information can be found in two separate published research papers. (Nguyen et al. 2021; https://www.sciencedirect.com/science/article/pii/S0140988321000347) , Scope 3 Emissions: Data Quality and Machine Learning Prediction Accuracy
Key Outcome of ResearchOur best performing met-model predicts Scope 1+2 emissions for the world's largest companies within ~10%.
What carbon data-set did we use?
Any data model requires a clean, robust data-set to ‘train’ the models. For our training data-set, corporate carbon emissions data between 2018-2021 were used for over 5000 companies via data providers (CDP and ISS). We sourced financial information for these companies via FactSet.
It is considerably more accurate to predict this years emissions when you have some knowledge of the historical emissions of that company (Nguyen et al., 2021). Additionally, financial data reported from companies is often incomplete. For example, revenue or employee numbers are missing. Ignoring this missing data limits the training data-set. To maximise the amount of training data used for our models including previous year emissions, we impute input financial data - which simply means we replace missing data using advanced imputation methods such as Multiple Imputation by Chained Equations (MICE).
What models were explored?
We created a database of 20,000 different machine learning models and found the best models include, Gradient Boosting, Random Forest, Linear Tree and a meta-model median of our best 12 models. We also optimised the hyperparameters of these models to obtain the most robust models. You can read more about those models here.
What is a Meta-Model?
Our meta-models take the mean, median or max of the best 12 well trained models such as those described above. By combining the predictions of multiple models, the overall prediction accuracy and model stability is improved. By using the median of several predictions, the meta-model can effectively reduce the impact of outliers or individual model biases that may negatively affect the final prediction. This approach is better and more robust than relying on a single model, as it can help reduce overfitting and increase the generalisation and performance of the model. Furthermore, using multiple robust models can also help capture different aspects of the data, leading to a more comprehensive understanding of the underlying patterns in the data.
What predictors did you explore?
We explored 64 different financial predictor sets to test the skill of estimating Scope 1, 2 & 3 footprints for listed companies. Some predictor sets included Revenue, Country, City, Employee Number, GICS Sector, GICS Industry, Energy Use, Total Assets, Net Property, Plant and Equipment (NPPE), Capital Expense, Gross Profit, Operational Expense, EBIT, EBITDA, Net Income, Intangible Gross Debt, Capital Intensity, Asset Age, Costs of Goods, Total Debt, Current Liability, Current Assets.
How do you test the skill of each model?
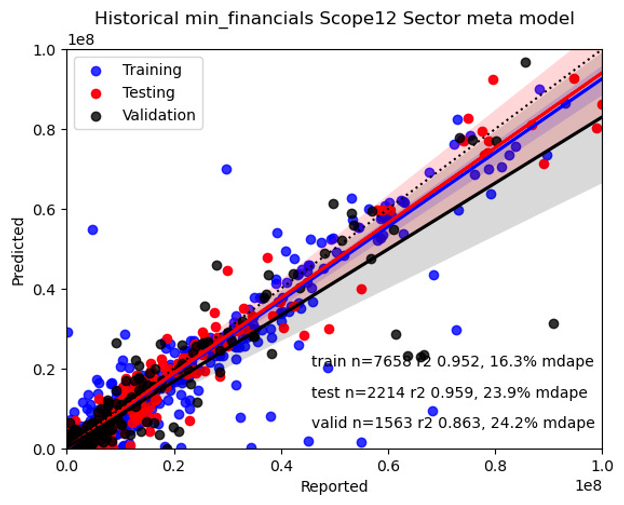
We used a training, testing and validation data split to ensure that 65% of the data was used in training, 20% in testing and 15% was quarantined in order to independently validate the results. Here’s a visualisation of the carbon training reported versus predictions using three different models.
What is the accuracy of your models?
Our meta models combine the accuracy of our best 12 Machine learning models. Each scope has a different distribution and slightly different model accuracy. We achieve 10% accuracy for Scopes 1+2 for the largest 300 Companies (see here). For the entire universe, our Scope1+2 model has a 30% accuracy and Scope 3 has 47%. Our models are 2-3 times more accurate than traditional industry methods using Revenue and Country intensity factors.
What is the PCAF score of your models?
The PCAF (Platform for Carbon Accounting Financials) scoring system is a well-established and widely recognised carbon rating system that classifies carbon emission estimate accuracy on a scale between 1 and 5. This system provides a framework for evaluating a company's carbon emissions and enables stakeholders to make informed decisions based on the most accurate emissions data.
Our machine learning models are designed to achieve high accuracy, using advanced imputation and meta-modelling techniques, and a comprehensive suite of financial data to account for a broad range of factors contributing to carbon emissions. We estimate our models achieve a PCAF score of 3.5 or higher, particularly for the largest companies in the world where the accuracy is within ~10-15%.
Do you predict Scope 3 emissions any differently?
No, the majority of our universe uses the same machine learning methods for all scopes 1,2 and 3. The error however is worst for Scope 3 predictions (and best for scope 1+2). Our team led by Nguyen et al., (2002) showed that it is possible to improve Scope 3 estimates by including the 15 categories of Scope 3 breakdown. However, this data has low reporting rates, lots of gaps and systematic reporting biases (ie travel is easier to calculate / report). However, improving Scope 3 emissions estimates will continue to occur over subsequent emissions data releases.
However one exception is the financial sector, where reported Scope 3 estimates are limited. We have therefore built a financial sector model for Scope 3 emissions that uses PCAF financed emissions database and a banks financial information total assets and loan books to estimate the Scope 3 for this sector.